
As a SharePoint in Microsoft 365 site owner, you can view information about how users interact with your site. For example, you can view the number of people who have visited the site, how many times people have visited the site, and a list of files that have received the most views.
To view usage data for your site, click the settings gear

Important:
-
Site admins, owners, members, and visitors can view site usage data.
-
Site visitors cannot run external user reports or download the 90-day usage report.
-
Some functionality is introduced gradually to organizations that have set up the targeted release options in Office 365. This means that you may not yet see this feature, or it may look different than what is described in the help articles.
-
Lifetime stats are shown for sites created after February 2018. Sites created before this date will show stats from February 2018 forward.
-
Guest users with Site Owner permissions will not have access to site analytics or site usage data.
-
Guest and anonymous views and visits are included for sites after March 2019 and forward.
-
Site usage reports are only supported for Worldwide Production Environments and for some Special Cloud deployments of Microsoft 365. See below for details.
-
User activity reflected in the report will not include usage data collected in the last 60 minutes.
What's on the site usage page
Notes:
-
All reports on the site usage page exclude some file extensions, except for the Shared with external users report. Details about the list of extensions that are excluded from each report is shown at the bottom of the page.
-
To view the names of the individuals who have accessed your site, your SharePoint administrator will need to activate the SharePoint Viewers setting.
-
When the SharePoint Viewers setting is enabled, individual names will be seen in the library hover card, not on the Site Usage page.
-
Usage data for Unique viewers, Site visits, and Average time spent per user is aggregated and displayed based on Coordinated Universal Time (UTC).
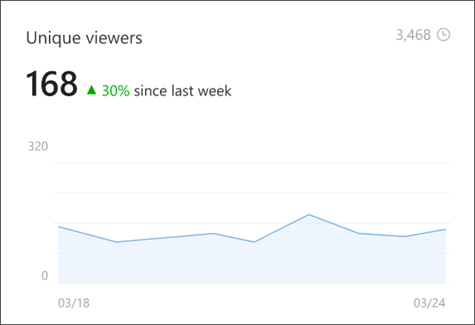
Unique viewers
Shows the total number of individual visitors to the site, regardless of how often they've visited. Usage data accounts for user activity for site content such as pages, documents, and news, including 'news for email' inbox viewers. This data is presented using the Coordinated Universal Time (UTC).
You can review daily unique viewer trends on your site for the last 7 days, last 30 days, and last 90 days. The overall unique viewer count is available for the last 7 days and the last 30 days.
In the example below, the 7 day view for this site tells us there have been 168 unique views which is a 30% increase in traffic from last week. On the right-hand side of the graph, you'll see the lifetime unique viewers which is the total number of people who viewed content on this site since February 2018 and in this example is 3,468.
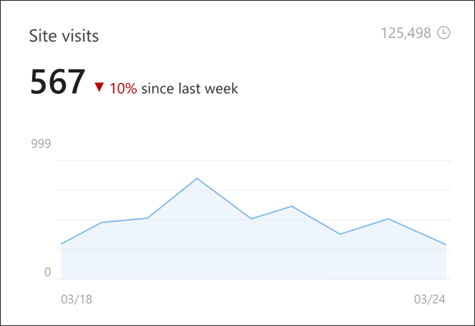
Site visits
Shows the total number of visits to content on this site for the last 7 days, last 30 days, and last 90 days. Site content includes pages, documents, and news, including 'news for email' inbox views. This data is presented using the Coordinated Universal Time (UTC).
The algorithm used to calculate Site visits is designed to filter out repetitive, continual operations by the same user on the same item (page, document, or news). For example when a user repeatedly refreshes a page, document, or news post.
In the example below, the 7 day view for this site tells us there have been 567 site visits which is a 10% decrease in traffic from last week. On the right hand side of the graph, you'll see the lifetime site visits which is the total number of people who viewed content on this site since February 2018 and in this example is 125,498.
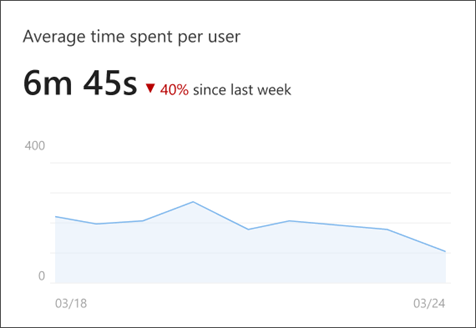
Average time spent per user
Note: A small amount of traffic will not be accounted for in this report due to web browser restrictions.
Shows the trend of actual time spent on modern SharePoint site pages and news posts by users. The report calculates the time when users are actually active on the page or news post, not counting the time when the page is minimized or when the user has the page open but is inactive. The average metric for 7 and 30-day period is calculated by measuring the total time spent on that page and the number of the unique visitors on that page in the given timeframe. This data is presented using the Coordinated Universal Time (UTC).
This report currently does not provide the average value for 90-day period and does not support lists, documents, administrative pages (such as the site usage or site permissions page), or News for Email inbox views. Usage on mobile app is currently not incorporated in calculation of this report.
In the example below, the 7 day view for this site tells us average user spends 6 minutes and 45 seconds actively engaged with your site which is a 40% decrease from last week. There is no lifetime average time spent per user metric.
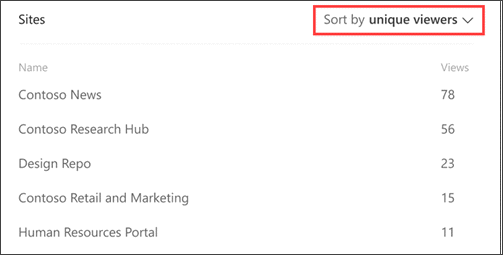
Popular content
Shows the most popular content on the site sorted by site pages, news posts, and documents. Popular content can be sorted by unique viewers, total views, or time spent for site pages and news posts. This report is available for the last 7 days.
For popular documents, sorting is available by unique viewers or total views.
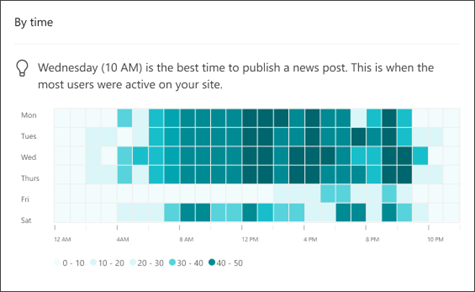
Site traffic
Shows the hourly trend of visits to the site over the last 7 days, last 30 days, and last 90 days for the viewer's local time zone. Darker shades on the chart refer to time slots when there are more views on the content in the site. Use this map to determine to best time to post news and big announcements.
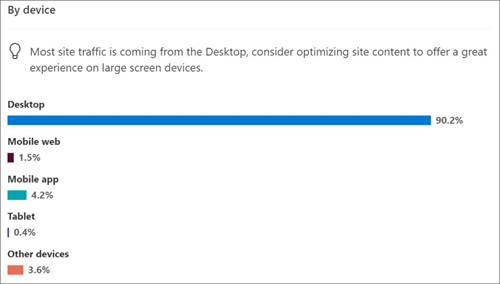
Popular Platforms
Shows the distribution of visits to the sites' content organized by the platform (desktop, mobile web, mobile app, tablet. This data is available for the last 7 days, last 30 days, and last 90 days.
This report is generated based on "user agent" headers which are part of the received metadata when a user visits any site content.
Export site usage data in excel file
Site owners can export the 90-days site usage data in an excel file by going to the download button on site usage page. Select the button to download 90-days data for unique viewers, site visits, popular platforms and site traffic. For popular content on the site (news posts, documents and pages) the report will be for last 7 days.
To export a site usage report, select the download icon near the right hand corner of the page:
Notes:
-
The site usage report download does not include data for Shared with external users in the report.
-
The site usage report download does not include data for average time spent per user.
-
To export a Shared with external users report, you need to extract this data to a CSV file by clicking the Run Report button on the bottom right corner of the page. You cannot select a time period and data includes the attributes: Resource Path, Item Type, Permission, User name, User Email, User or Group Type, Link ID, Link Type, AccessViaLinkID.
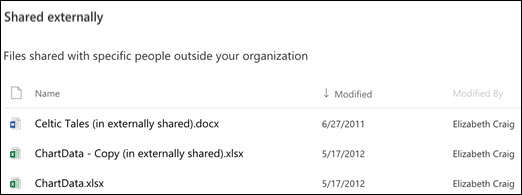
Shared with external users
List of files that you have access to that are shared with users outside your organization through a sharing link that requires them to log in before they can view the file.
Usage reports for SharePoint hub sites
Notes:
-
Hub usage page metrics for Popular content will vary depending on the viewers permission level. However, the aggregated report for Unique viewers and Hub visits will reflect metrics for the entire hub regardless of viewer permission.
-
Hub analytics reports support analytics for up to 200 sites in the hub. If your hub contains more than 200 associated sites, then you will only be able to data for the top 200, most recently used sites in this report.
SharePoint hub sites help you meet the needs of your organization by connecting and organizing sites based on project, department, division, region, etc. Admins and members of the hub site can see aggregated usage data for all associated sites in the hub by clicking the settings gear
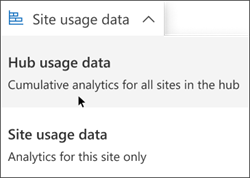
The "Unique Viewers" and "Hub Visits" reports on the page show aggregated usage data for all sites in the hub for the last 7 and 30 days. The "Popular content" report shows the top pages, news posts and documents across all associated sites in the hub in the last 7 days. Find out which sites are most popular in the hub by seeing the "Sites" section within the Popular content report.
To analyze usage data for only the hub site (without aggregating data from the associated sites), you can use the drop-down on the top-right of the page to switch to seeing data for the hub site only.
Usage reports for special cloud deployments of M365
Your organization's SharePoint tenant may not include all of the site usage reporting functionality depending on special cloud deployments scenarios for M365. Ask your M365 administrator which type of special cloud deployment your organization uses to understand what site analytics report data is available to you.
|
Site usage details |
Availability depending on environment |
|---|---|
|
Unique Viewers Site Visits Site Traffic Popular Content |
Available to all SharePoint deployment types except for Office 365 operated by 21Vianet (China.) |
|
Average Time spent per user Popular Platforms Export Site Usage Data in excel file |
These reports are not available for the following environments:
|
|
Hub Usage |
Not available for:
|
Permissions
To edit the permissions for any item in this list, click 
Excluded File-Types
The following file-types are currently excluded from all reports on Site and Hub Usage (except "Shared with external users" report):
jpg, png, js, css, gif, jpg5_1, jpeg, one, onepkg, onetoc2, spcolor, sptheme, spfont, eot, ico, onebin, svg, woff, woff2, xsl
Monitoring usage data for apps
Monitor apps for your SharePoint Online environment describes how to monitor apps from the Admin dashboard. From the Microsoft 365 home page, click Admin center, and then click Usage. You can explore usage of email, files, OneDrive, and more.
Exporting the 'Shared with external users' report
The Shared with external users report can now be exported for further analysis and reporting. Site Owners and admins can extract this data to a CSV file by clicking the Run Report button on the bottom right corner of the page. You cannot select a time period and data includes the attributes: Resource Path, Item Type, Permission, User Name, User Email, User Or Group Type, Link ID, Link Type, AccessViaLinkID.
Get usage analytics for a SharePoint page or news post
With page analytics, you can view information about how users interact with your page or news post. For example, you can view the number of people who have viewed the page over periods of time, average time spent on the page spent per user, and page traffic by time.


